Institutional Trading Platform Costs

Key Takeaways
- The licence fee for an institutional trading platform is rarely the real cost. Industry data shows total cost of ownership runs 2-3x the quoted price when hosting, support, integration, and operational workarounds are included.
- A global settlement failure rate of just 2% costs the industry an estimated $3 billion in losses annually (DTCC). In Europe, settlement failure penalties on Target2-Securities averaged EUR 70.43 million per month in 2024.
- The industry spends $12-17 billion annually on core post-trade functions. Oliver Wyman estimates that middle- and back-office reforms - including post-trade processing - could boost pre-tax profits by 25%.
- Multi-vendor trading infrastructure creates a reconciliation tax: large hedge funds load 500+ files daily from prime brokers and custodians. Multi-party reconciliation routinely consumes weeks of staff time per month before automation.
- 63% of institutional operators consolidate to a single core platform vendor within 18 months of selection (Gartner 2026), with integration depth ranked above feature breadth in 52% of decisions.
The Platform Cost That Nobody Quotes
When a hedge fund or asset manager evaluates an institutional trading platform, the procurement conversation centres on licence fees, per-seat costs, and perhaps a line item for implementation. That number represents roughly a third of what the platform will actually cost to operate.
Broadridge estimates the financial services industry spends $12-17 billion annually on core post-trade and related functions, with $6-9 billion of that going to processing trades in highly standardised asset classes alone - equities and fixed income, excluding OTC derivatives. For the average tier-one institution, technology and operational improvements in this area represent $100-300 million in annual savings potential.
The gap between quoted cost and real cost exists because five infrastructure layers generate expenses that never appear in a vendor’s pricing sheet. Each layer compounds with the others. Understanding where these costs hide is the difference between a platform decision that lowers operational burden and one that merely relocates it.
Layer 1: Settlement Failure Costs
Settlement failures are treated as a fact of life in institutional trading. They should be treated as a line item.
DTCC data shows approximately 2% of US equity trades fail to settle. At trillions in daily volume, that 2% failure rate generates an estimated $3 billion in costs and losses annually - covering penalty fees, buy-in costs, funding charges on unsettled positions, and the operational overhead of resolution.
The numbers in Europe are more visible because regulators publish them. Settlement failure penalties on the Target2-Securities platform averaged EUR 70.43 million per month in 2024 under the Central Securities Depositories Regulation (CSDR) penalty regime. The penalty is a cash charge for every day a trade remains unsettled past the intended settlement date.
Where do these failures originate?
| Cause | Share of Failures | Root Issue |
|---|---|---|
| Counterparty shorts | 71% | Counterparty does not have the securities to deliver |
| Data issues (SSIs) | 21% | Incorrect or stale standing settlement instructions |
| Operational errors | 8% | Manual processing, timing mismatches, communication gaps |
Source: DTCC Accelerated Settlement Paper (2025), based on 2024 interviewee data
The SSI problem is revealing. Standing settlement instructions - the account details that tell a counterparty where to deliver securities or cash - are responsible for roughly 20% of all settlement fails. DTCC estimates that approximately half of institutional participants still send this critical information manually rather than through a secure platform. Every manual SSI transmission is an error surface and a potential failed trade.
For a fund evaluating platforms, the question is not whether the platform can execute trades. It is whether the platform’s settlement architecture - multi-rail connectivity, automated SSI management, netting, and failed trade workflows - reduces the 2% baseline or perpetuates it. Early adopters of automated SSI platforms report a 40-50% reduction in settlement fails.
Layer 2: The Multi-Vendor Reconciliation Tax
Reconciliation is the operational cost that scales with complexity, not volume. Every additional vendor, prime broker, or custodian in the infrastructure stack multiplies the daily reconciliation burden.
A global hedge fund case study published by Gresham Technologies illustrates the scale: the firm transacts up to 10 million trades per day, generating 20 million core reconciliation records daily. It works with more than 100 prime brokers and custodians, loading over 500 files each day for reconciliation. The firm’s previous legacy reconciliation platform could not handle the volume, costing significant time, money, and missed market opportunities.
Most funds operate at smaller scale, but the pattern is the same. AIMA (Alternative Investment Management Association) documents that multi-party reconciliation - matching trade and position data across the fund, its custodian, and its administrator - routinely requires manual intervention. Before automation, clients report end-of-month reconciliation consuming weeks, not days.
The cost appears in three places:
Headcount. Operations teams sized for reconciliation, not investment operations. AltHQ’s 2025 Benchmark Report found that alternative-asset operations cost 5-10x more than public-market operations per dollar managed, with manual document handling identified as the single largest avoidable cost category - automation reclaims up to 80% of those staff hours.
Error propagation. Every manual reconciliation touchpoint is a break waiting to happen. Unresolved position breaks between the fund and its prime broker cascade into NAV errors, incorrect margin calculations, and misreported risk. The back office exists to prevent this, but prevention at scale requires automation, not additional headcount.
Vendor lock-in through complexity. Once a fund has built reconciliation workflows around a specific combination of OMS, prime broker connections, fund administrator, and custodian, the switching cost is not the new vendor’s licence - it is rebuilding every reconciliation bridge. The OMS case study firm CWAN documented that total cost of ownership for a legacy order management system runs 2-3x the sticker price when hosting, support, professional services, and manual workarounds are included.
Tired of reconciling across multiple vendors? Aerapass consolidates execution, settlement, and reporting into a single platform across six licensed jurisdictions. See how the Aerapass multi-asset exchange reduces integration overhead
Layer 3: Compliance Configuration Per Jurisdiction
Regulatory compliance is not a single capability. It is a separate configuration for every jurisdiction where a fund operates, each with different data fields, reporting formats, submission timelines, and oversight bodies.
| Jurisdiction | Key Regulation | What It Requires | Reporting Entity |
|---|---|---|---|
| EU/EEA | MiFID II (RTS 27/28) | Best execution reporting, transaction reporting to ARMs | ESMA-supervised |
| EU/EEA | EMIR Refit (Apr 2024) | OTC derivatives reporting in ISO 20022 XML, trade repository submission | ESMA |
| Singapore | MAS SFA | OTC derivatives reporting above de minimis, documented best execution policies | MAS |
| Hong Kong | SFO | OTC derivatives transaction reporting including FX forwards and NDFs | SFC |
| Australia | ASIC | Derivatives reporting, AFS licence conditions, client money rules | ASIC |
| United States | SEC/CFTC | Form PF (private funds), trade reporting, qualified custodian requirements | SEC |
Sources: ESMA MiFID II RTS 27/28; MAS Securities and Futures Act; SFC Securities and Futures Ordinance; SEC Form PF
A fund domiciled in Singapore with investors in Hong Kong and Europe does not need “compliance.” It needs three distinct compliance configurations, each generating different reports on different schedules in different formats for different regulators. Platforms licensed across these jurisdictions absorb this configuration cost; platforms licensed in one force the fund to bridge the gap externally. When the EMIR Refit introduced ISO 20022 XML reporting in April 2024, every firm with European derivatives exposure had to update its reporting pipeline - not its compliance policy, but its data infrastructure.
The cost that fund managers miss: compliance is not a feature you buy once. It is an ongoing configuration expense that compounds with every jurisdiction you add. Platforms that treat compliance as a monolithic module rather than a per-jurisdiction framework force the fund to build supplementary reporting pipelines externally - at the fund’s cost, not the platform’s.
Layer 4: Custody Model Switching Costs
Custody is the infrastructure decision with the highest switching cost because it involves moving client assets between legal structures. The wrong initial custody decision is not expensive to make - it is expensive to undo.
The core variables:
Segregation model. Omnibus accounts (client assets pooled) vs segregated accounts (client assets individually identified). SEC Rule 15c3-3, MAS licensing conditions, and FCA CASS 6 rules each impose specific segregation requirements. Moving from an omnibus model to a segregated model requires asset-by-asset migration, updated legal documentation, and re-notification to regulators. For institutions evaluating tokenised securities custody, Solvency II look-through rules and per-policy asset backing add further complexity.
Bankruptcy remoteness. The structural protection that ensures client assets are not treated as the platform’s assets in insolvency. This is an entity-structure question, not a technology question - the legal framework around the custody vehicle determines whether assets are protected. Porting from one bankruptcy-remote structure to another involves legal counsel in every jurisdiction where assets are held.
Multi-custodian coordination. Funds increasingly use multiple custodians for diversification. Each custodian relationship requires its own reconciliation workflow, its own regulatory notification, and its own integration. Adding a custodian is not plugging in a new API - it is standing up a new operational relationship.
The hidden cost: platform evaluations compare custody features. They rarely model custody migration cost. A fund that selects a platform with custody included, then needs to switch platforms three years later, faces a custody migration project that can take 3-6 months and require legal review in every jurisdiction where client assets sit.
Layer 5: The Integration Compound Effect
Each of the four layers above generates cost independently. The compound effect is what makes them collectively destructive to operational margins.
A fund running a separate OMS, EMS, risk system, fund administrator, and compliance platform must integrate all five systems. Each integration is a reconciliation point. Each reconciliation point is a potential break. Each break requires operational staff to investigate and resolve. The compound is not additive - it is multiplicative, because a break between any two systems can cascade through the others.
Oliver Wyman estimates that reforms of middle- and back-office operations, including post-trade processing, could produce enough savings to boost industry pre-tax profits by 25%. The savings exist because the current multi-vendor model carries structural overhead that integrated infrastructure eliminates.
The industry is responding. Celent’s 2026 FinServ Technology Outlook found that 71% of mid-market institutions standardise their core systems on the same vendor family specifically to cut data-reconciliation costs. Gartner’s 2026 Magic Quadrant for Financial Services reported that 63% of operators consolidate to a single core platform vendor within 18 months of selection, with integration depth ranked above feature breadth in 52% of purchase decisions.
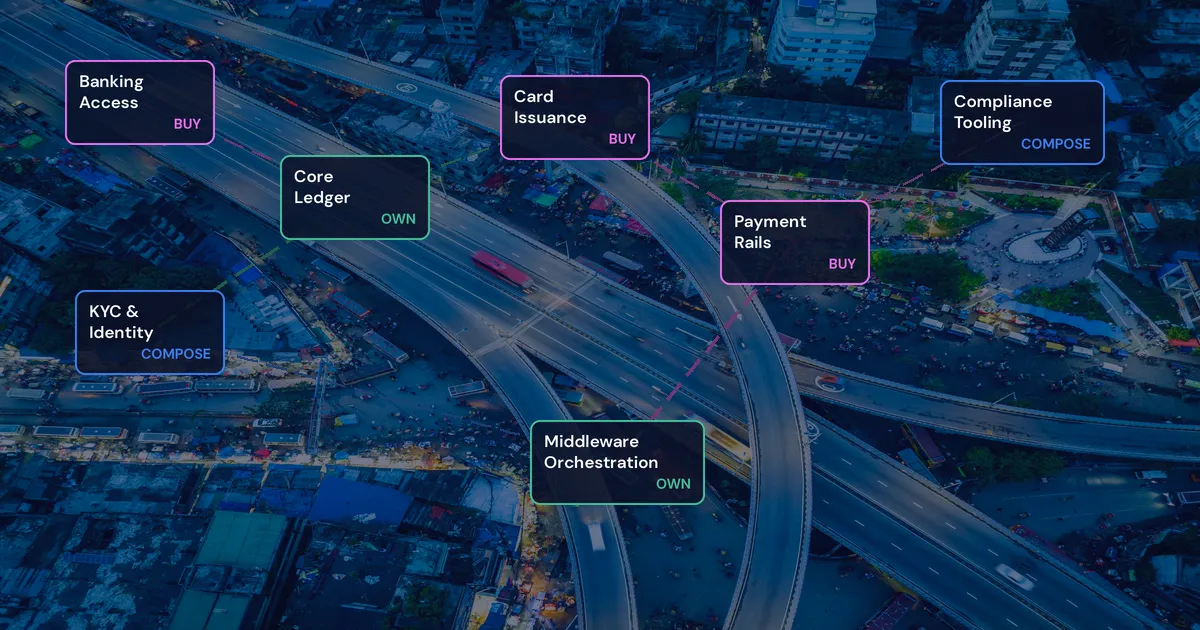
The trend line is clear: the industry is moving from assembled infrastructure (best-of-breed point solutions connected through middleware) to integrated infrastructure (single platform covering execution, custody, compliance, and fund operations) because the integration compound makes assembled infrastructure more expensive to operate than any individual component suggests.
What to Model Before You Evaluate
Platform selection conversations that begin with feature comparisons miss the structural costs. Before evaluating vendors, model these five costs against your current infrastructure:
Settlement cost baseline. What is your current settlement failure rate? What does each failed trade cost in penalties, buy-in charges, and staff time? Any platform that does not demonstrably lower this rate is not reducing your post-trade costs - it is just moving them.
Reconciliation FTE burden. How many full-time equivalents does your operations team dedicate to daily reconciliation across prime brokers, custodians, and administrators? A platform that adds another reconciliation point is a headcount increase, not a technology improvement.
Compliance configuration cost. How much do you spend annually on regulatory reporting configuration, updates, and submissions across all jurisdictions? Platforms that treat compliance as a single module will push per-jurisdiction configuration costs onto your internal team.
Custody migration scenario. If you needed to leave the platform in three years, what would the custody migration cost? If the answer is “we have not modelled that,” the platform has more leverage over your future decisions than you intend.
Integration map. Draw every data flow between your trading systems. Count the reconciliation points. Each point is a cost centre. Multi-asset platforms that reduce the total number of integration points deliver savings that compound with every trade, every day, across every fund structure.
The platform that looks cheapest on a pricing sheet is often the most expensive to operate. The platform that looks most expensive may eliminate enough structural overhead to deliver the lowest total cost of ownership. The difference is visible only when you model the five layers that never appear in a vendor proposal.
Aerapass consolidates execution, custody, compliance, and fund operations into a single platform across six licensed jurisdictions - eliminating the integration compound that drives hidden costs in multi-vendor infrastructure.
Evaluating your trading infrastructure costs? Aerapass consolidates execution, custody, and compliance into a single platform across six jurisdictions. Explore the Aerapass institutional trading platform
Frequently Asked Questions
How much does institutional trading infrastructure actually cost per year?
Total cost varies enormously by fund size and complexity. A single-strategy emerging hedge fund might spend $150,000-500,000 annually on core OMS/PMS licensing alone. Large multi-strategy funds with Bloomberg AIM, Charles River, or equivalent enterprise platforms face six- to seven-figure annual costs. When you add fund administration, prime broker connectivity, compliance tools, market data ($30,000-32,000/user/year for Bloomberg Terminal), and operational staff, the AltHQ 2025 Benchmark Report found all-in operational costs ranging from 54 basis points for large institutional investors to over 400 basis points for smaller investors - meaning a $500M fund could spend $2.7M-$20M+ annually on non-investment operations.
What is the real cost of a 2% settlement failure rate?
DTCC estimates the global cost at approximately $3 billion annually. For an individual fund, each failed trade incurs direct costs (CSDR cash penalties in Europe, buy-in charges, funding cost on unsettled positions) and indirect costs (operations staff time to investigate and resolve, counterparty relationship friction, potential regulatory scrutiny). European data shows settlement failure penalties averaged EUR 70.43 million per month across the T2S platform in 2024.
Why do 63% of institutional operators consolidate to a single platform vendor?
Gartner’s 2026 data shows the primary driver is integration cost reduction, not feature preference. Every vendor boundary creates a reconciliation point, and each reconciliation point requires data mapping, error handling, and operational oversight. Consolidation eliminates these boundaries. Celent found the same pattern: 71% of mid-market institutions standardise on the same vendor family specifically to reduce data-reconciliation costs. The economic logic is straightforward - the integration overhead of multi-vendor infrastructure often exceeds the premium of a single integrated platform.
How does adding a jurisdiction increase platform costs?
Each jurisdiction requires its own compliance configuration: different data fields for regulatory reports, different submission formats, different timelines, different oversight bodies. EMIR uses ISO 20022 XML; MAS SFA has its own OTC derivatives reporting format; HKMA/SFC requires separate trade repository submissions. A platform that supports one jurisdiction natively and treats others as add-ons forces the fund to build supplementary reporting infrastructure. The ongoing cost is not the initial setup - it is maintaining each jurisdiction’s configuration as regulations evolve, which compliance costs growing 5-10% annually according to industry benchmarks.
The content on this page is produced by Aerapass for general informational purposes only and does not constitute financial advice, investment advice, or any other form of professional advice. Aerapass is a technology platform provider serving financial institutions, wealth managers, and fintech companies. Before making any financial decision, you should consult with a qualified, licensed financial advisor who can take your individual objectives and circumstances into account.